All Level II displays have looked pretty much the same – until now.
This new Level II display presents market data in a visual and dynamic way. It allows you to visualize momentum and market shifts, to see patterns in the data that are invisible to those using a standard Level II display.
How does it work?
Simply select the exchange and instrument you’re interested in, and the tool will begin to show an animated display of the bids and asks as they are entered.
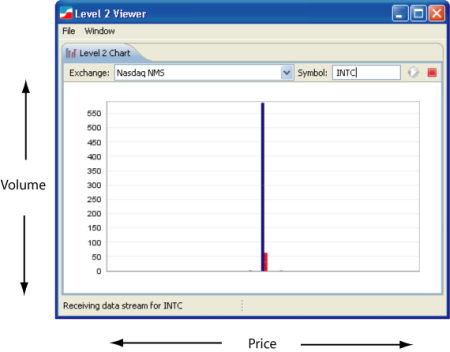
The vertical axis represents volume and the height of the various bars represent the total bids (in blue) and asks (in red) currently available in the market.
The horizontal axis represents price, and the bid/ask bars will travel to the left as price decreases or to the right as price increases. Note that the actual prices are not yet displayed. This is an early beta, and price displays will be coming soon, as will horizontal scrolling and many other features.
View it in action
The best way to understand what this tool does is to see it in action. The following short video shows how to connect the tool to a data feed and to begin viewing a data stream.

Welcome to Trading Tools Lab!
December 27, 2007The purpose of this blog is to create new software tools for traders by listening to what you have to say. I believe the best software is created when software developers and users collaborate, and that’s what this site is all about.
I’ll be posting prototypes of ideas that I have and what happens from that point is up to you. If you think an idea sucks, it gets tossed. If you like something, well maybe it’s time to turn the prototype into a reality. And if you have your own idea for a trading tool, let me know and I’ll see what I can do.
Posted in Commentary | Leave a Comment »